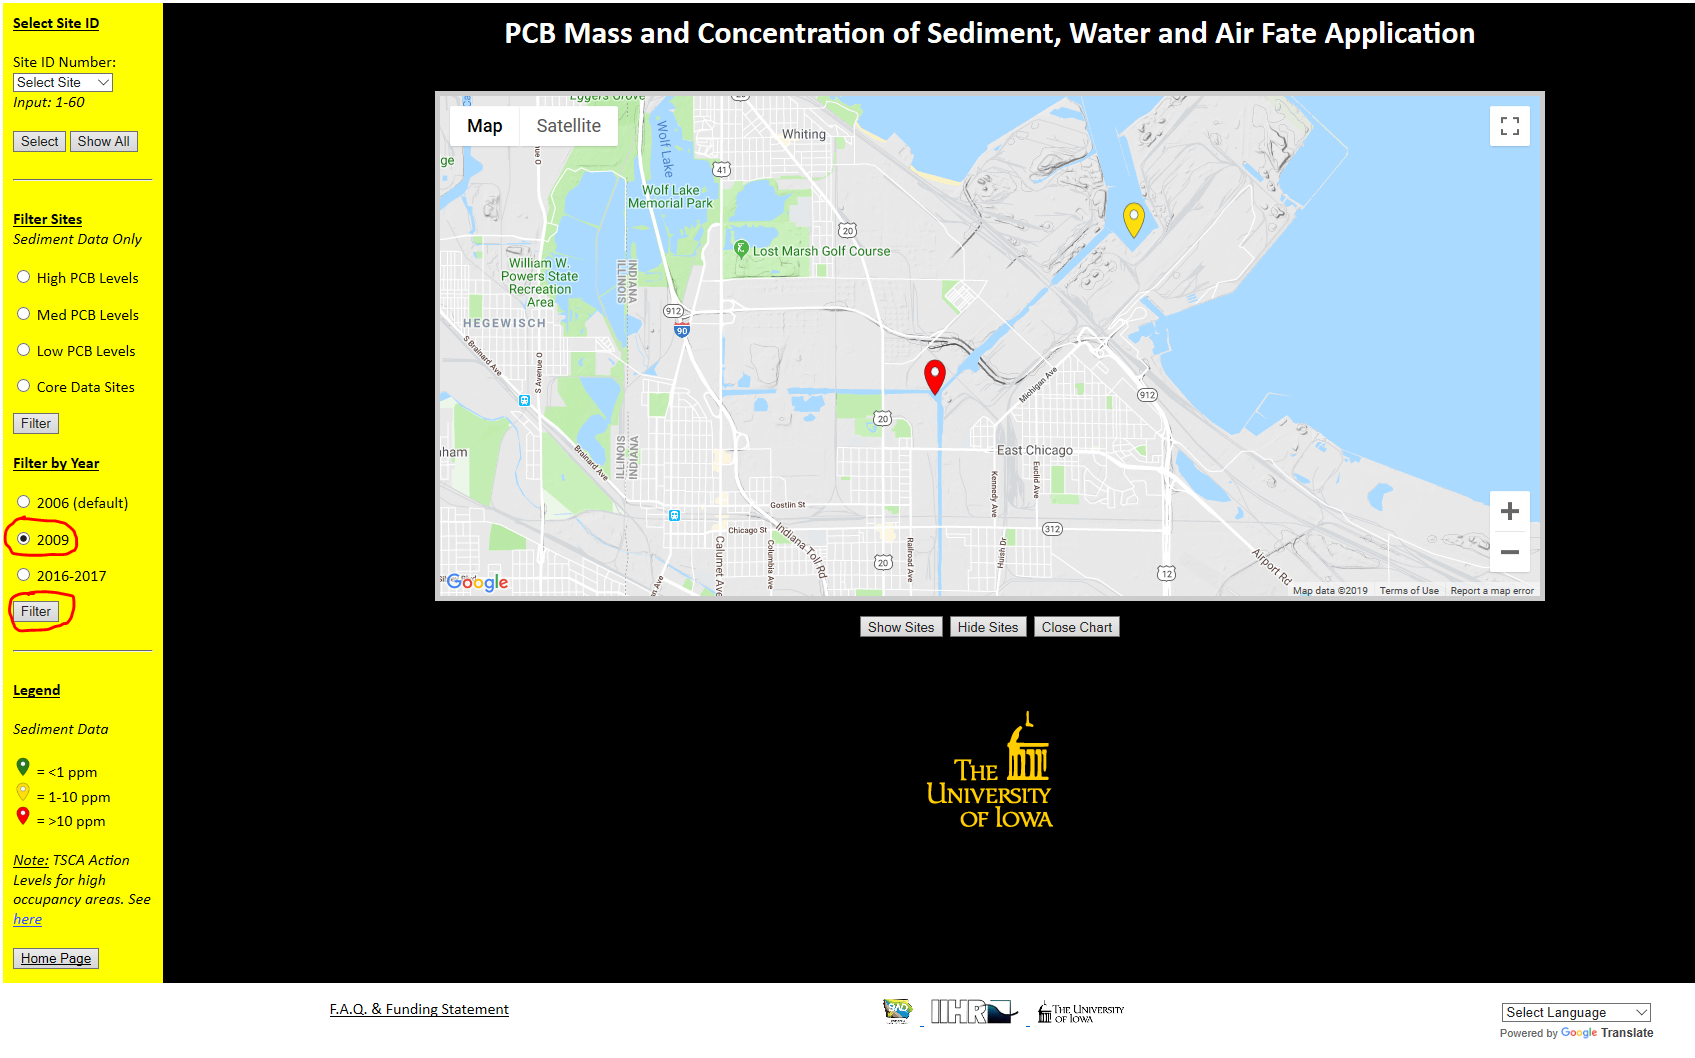
1. Filter Sites by ID Number (1-60).

2. Filter Sites by Concentration (High, Medium, Low) or Core Data Availability.

3. Filter Sites by Sampling Year. (2006-default, 2009, 2016-2017)
4. Click on a Site Marker to bring up an info-window.
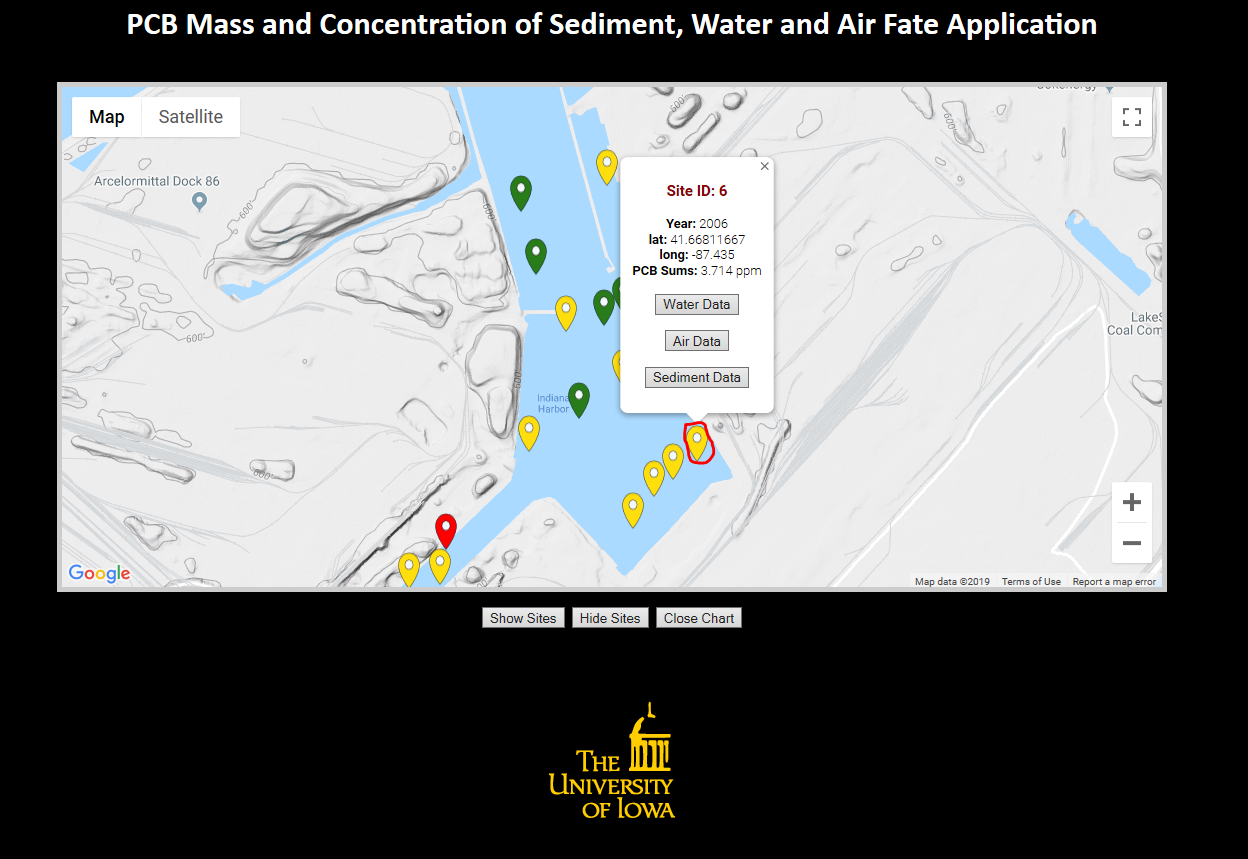
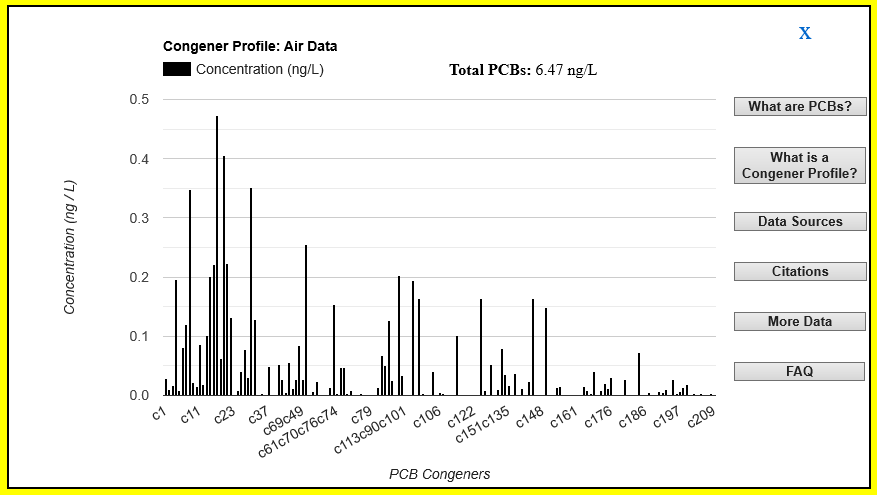
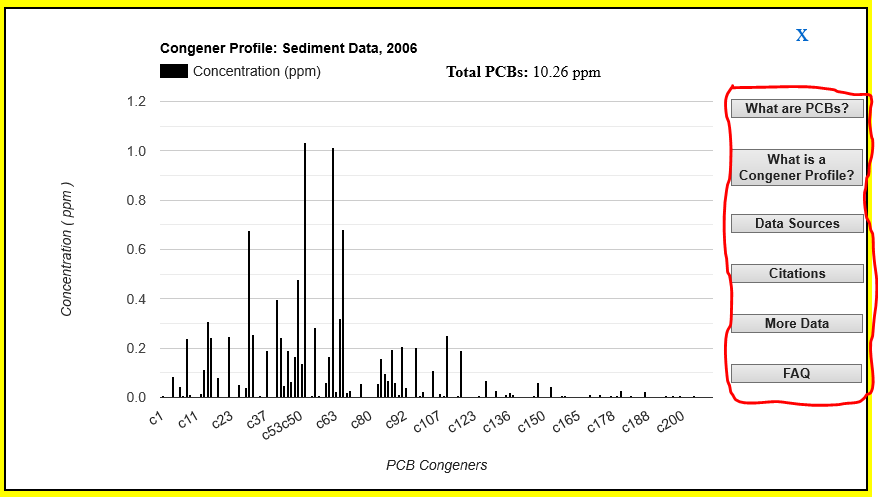
5. Click on the Water Data, Air Data, or Sediment Data button to view the PCB Concentrations
(2006 Data, Sites 1-60).

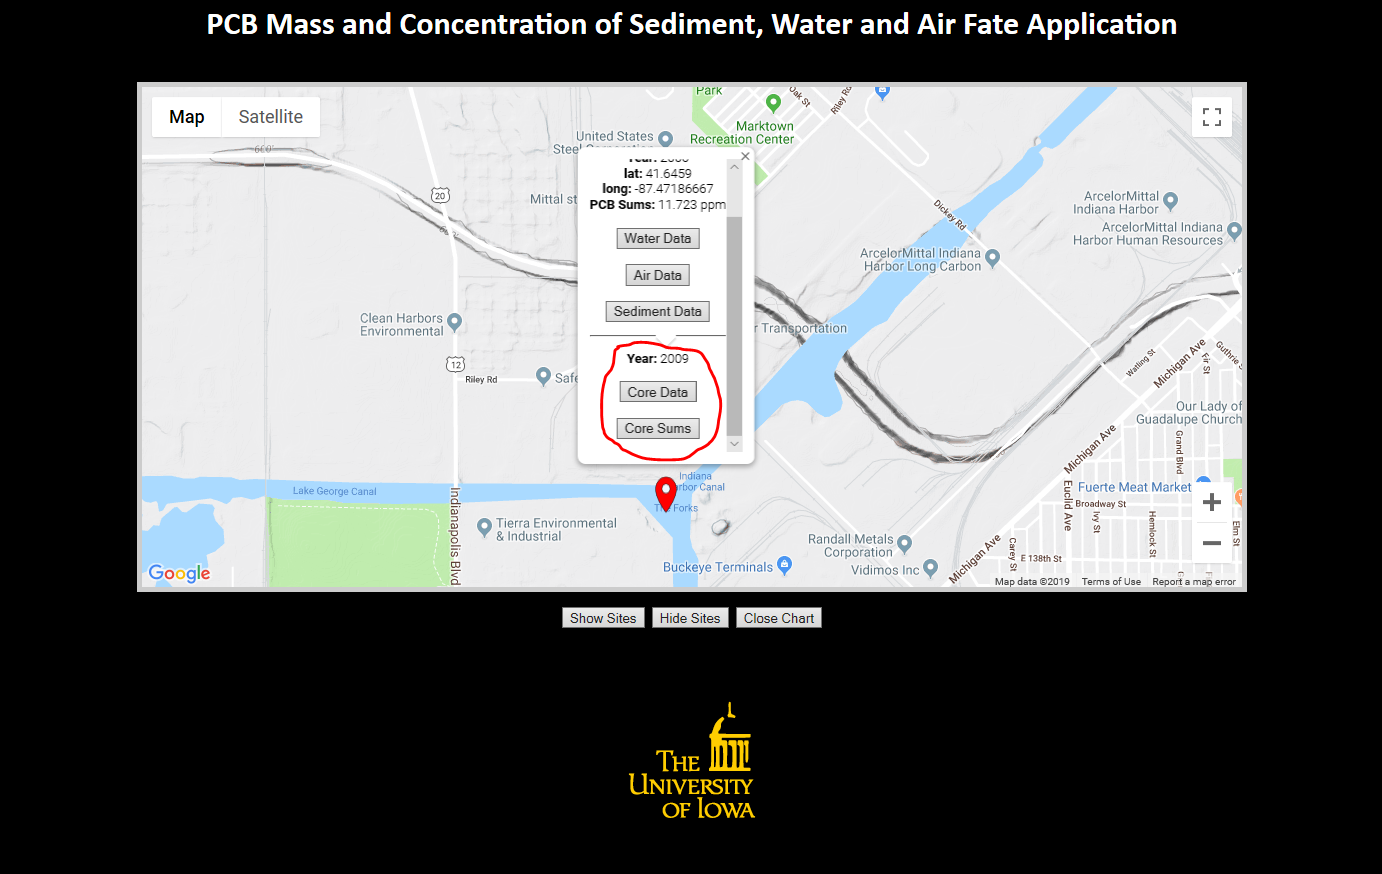
6. Click on the Core Data or Core Sums button to view the PCB Concentrations
(2009 Data, Sites #9 and #51).
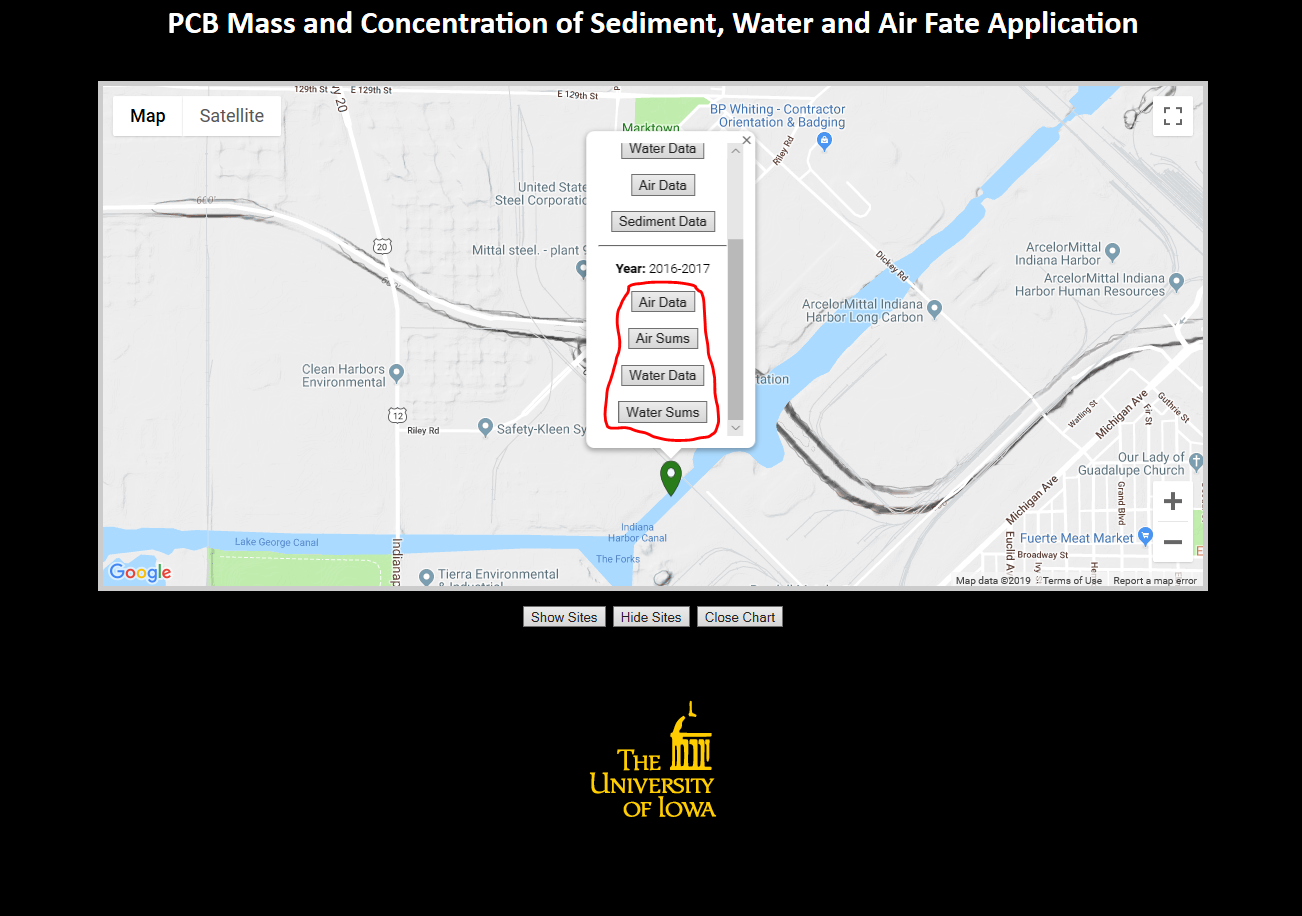
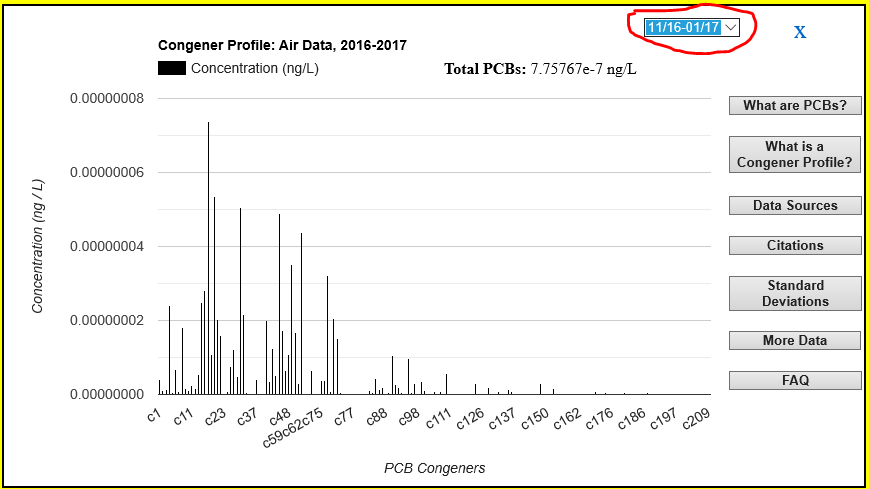
7. Click on the Air Data, Air Sums, Water Data, or Water Sums button to view the PCB Concentrations
(2016-2017 Data, Site #60).
8. PCB Congener Profiles will be generated for each "Data" Button.
Hover over a bar on the graph to display the individual congener's concentration.
9. For the 2009 Core Data, the chart will include a drop down menu to select a sampling depth.
Selecting a new depth will generate the corresponding Congener Profile.

10. For the 2016-2017 Data, the chart will include a drop down menu to select a sampling period.
Selecting a new date will generate the corresponding Congener Profile.
11. Scatter Plots will be generated for each "Sums" Button

12. Each chart has a button panel on the right side that provides data sources, citations, meta-data, and frequently asked questions.
13. The footer includes links to the FAQ, the Project's Funding Statement, Application Home Page, Sustainable Water Development Program (SWD), IIHR-Hydroscience & Engineering, and The University of Iowa.
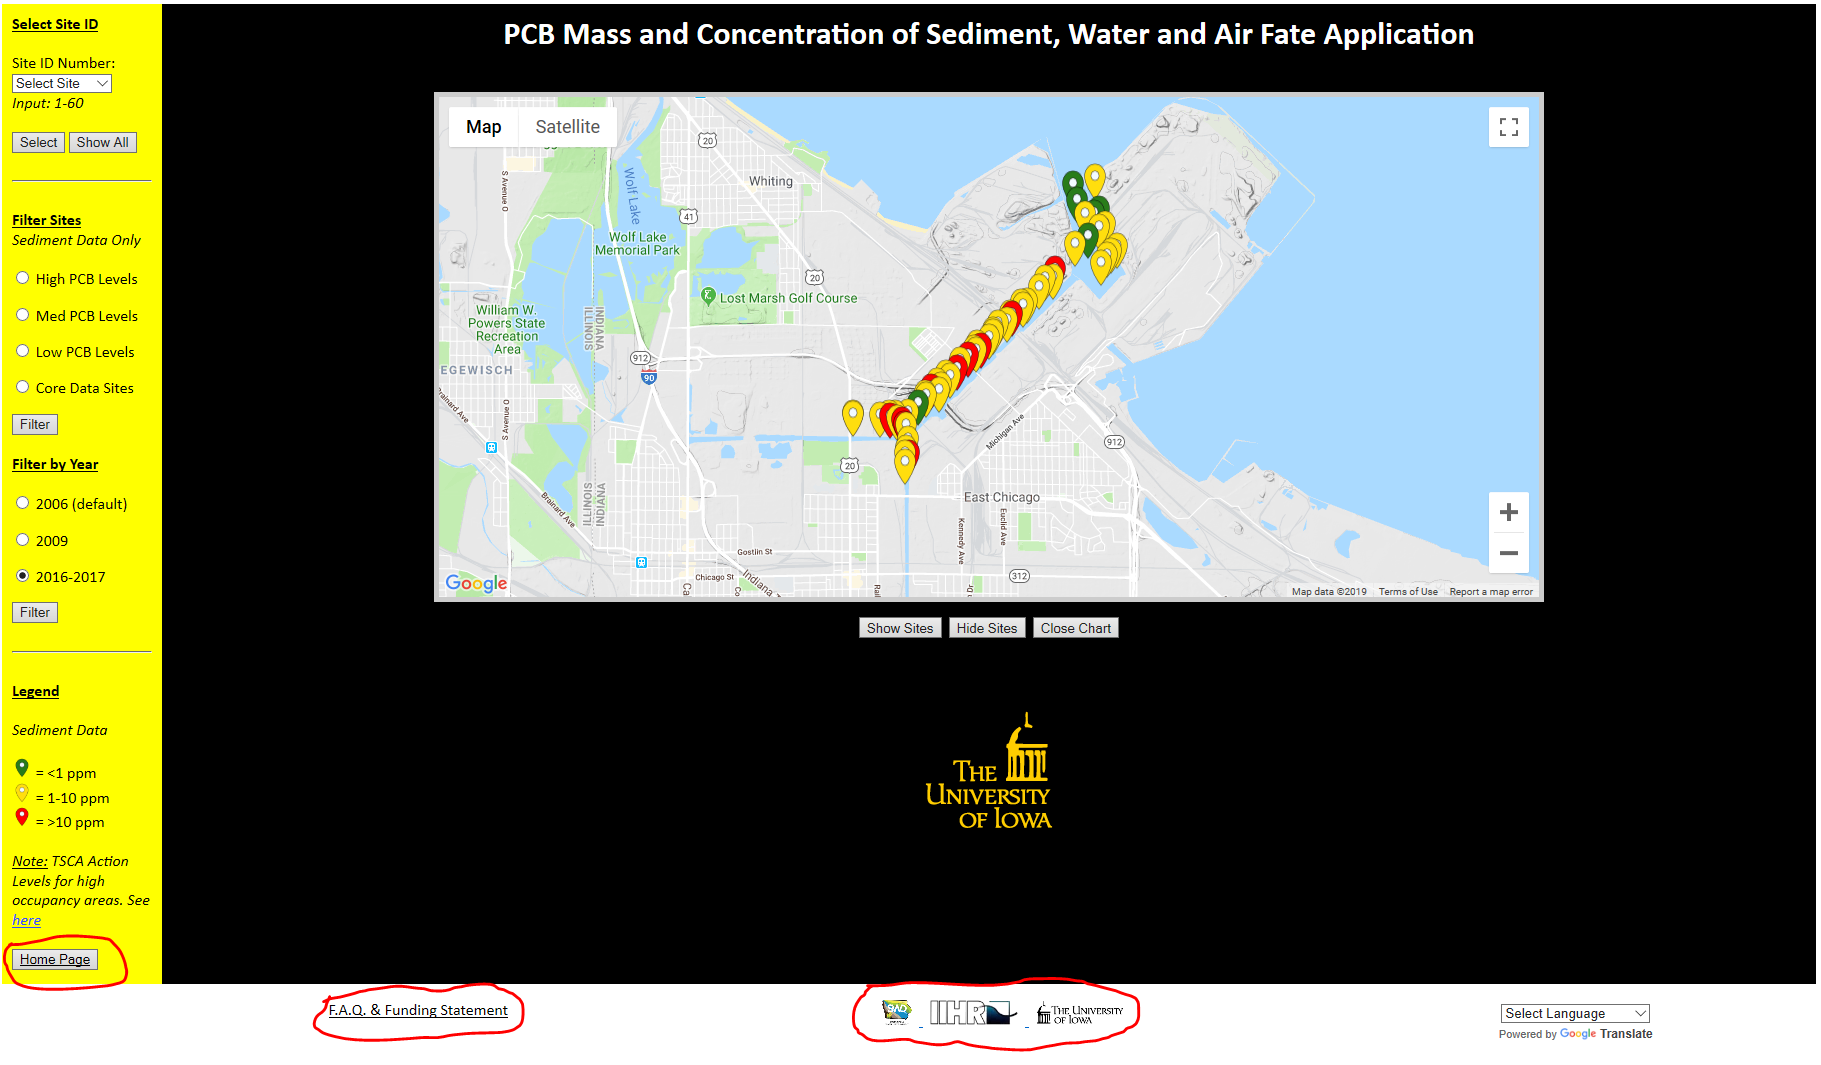
14. The Google Translate bar allows the user to switch between languages.